In this post we’re going to see how share.acquire.mode=record_limit combined with:
fewer consumers than partitions
and various cases of “partition skew”
…can result in subpar performance with share groups.
I stumbled on these issues when running large sets of dimensional tests with Dimster’s explore-limits mode, which finds the highest sustainable throughput while staying within a target end-to-end latency target. There was a specific subset of the tests that explore-limits mode would consistently fail to complete, and they all happened to be with record_limit and a consumer count lower than the partition count. In this test, we’ll understand why Dimster had such a hard time with this combination.
Some background on share group internals
Kafka share groups have two methods of acquiring records:
share.acquire.mode=batch_optimizedshare.acquire.mode=record_limit
I already explained the difference in Kafka Share Groups and Parallelizing Consumption - Part 2: Producer Batches and share.acquire.mode but let’s just cover it again.
Share consumers are assigned partitions as part of the share group protocol. It works similarly to the consumer group protocol, except that multiple consumers can be assigned to the same partition.
With batch_optimized, share consumers acquire records in whole batches, using max.poll.records as a soft cap. Furthermore, a share consumer assigned multiple partitions across multiple brokers will send fetch requests to each of those brokers, concurrently.
With record_limit, share consumers acquire records as slices of batches, where the size of the slice is determined by max.poll.records (now a strict cap). If you set max.poll.records=10 but the relevant batch contains 32, then only a slice of 10 records is acquired (though the whole batch is transmitted over the wire). Furthermore, a share consumer assigned multiple partitions across multiple brokers will send fetch requests round-robin (one-at-a-time) across those brokers. Each time you call poll, it will fetch from the next broker.
| max.poll.records | broker fetches | |
|---|---|---|
| batch_optimized | soft cap | concurrent |
| record_limit | strict cap | round-robin |
Dimster’s failing tests
Dimster consistently did not complete explore-limits tests with record_limit and fewer consumers than partitions. The issue is that during various phases of an explore-limits test, lag can build very quickly if producers shoot past the capacity of the consumers. Dimster sees this and attempts to drain the lag before it resumes with a lower producer rate.
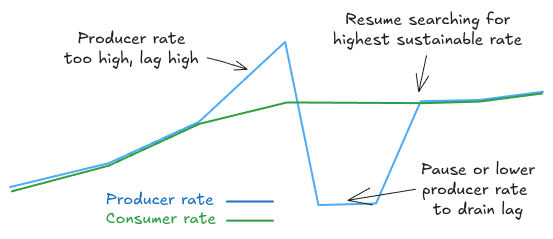
Fig 1. Dimster’s explore-limits mode regularly drains a backlog while searching for the highest sustainable rate under a target e2e latency
The drain works by pausing the producers, temporarily removing any consumer processing time (if configured) and then resuming with a lower producer rate. However, with record_limit and fewer consumers than partitions, this lag drain would basically stall as the consumption rate would end up just a trickle (such that it would take hours to drain the backlog that had accumulated).
So I ran some backlog drain tests to understand what was going on and discovered what I’ll refer to as pathological fetch waits.
Pathological fetch waits
Imagine one share consumer and a topic of 10 partitions spread across 3 brokers. Imagine if all the producers sent records to only one partition, leaving the other 9 consistently empty. What sub-optimal share consumer behavior might we see?
Let’s go through it. Remember, with record_limit, fetches to brokers are round-robin if a consumer is assigned multiple partitions (on different brokers):
Consumer sends a fetch to
broker-0(which hosts partitions 0, 3, 6, 9) and gets back some records for partition 0.Poll is called again, triggering a fetch to
broker-1(which hosts partitions 1, 4, 7), but there are no records.Poll is called again, triggering a fetch to
broker-2(which hosts partitions 3, 5, 8) but there are no records.Poll is called again, triggering a fetch to
broker-0, returning more records of partition 0.
So what’s the problem? Can you see it yet?
The problem is fetch.max.wait.ms. It defaults to 500. Yes that’s right, steps 2 and 3 took 1 second to complete and returned no records! 1 second where nothing is getting consumed, while partition 0 continues to receive records.
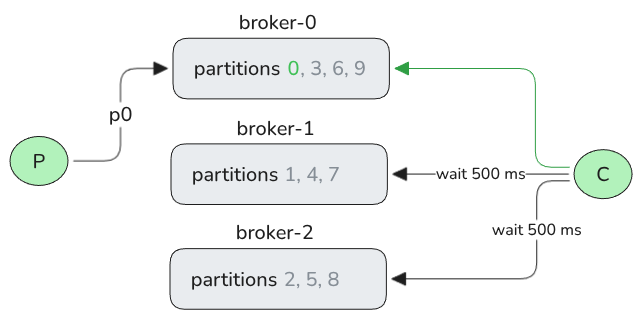
Fig 2. A single consumer, doing round-robin fetches across 3 brokers, does a lot of waiting when encountering brokers with 0 lag across their partitions (leader replicas).
Let’s run some benchmarks to understand how serious this issue can be.
Illustrating the record_limit fetch wait issue with Dimster
Case 1 - Draining a giant backlog without producer load
Setup: 1 topic, 10 partitions, 5 consumers, max.poll.records=500 (the default), backlog size 400M records.
This test generates a 400M record backlog using the MessageDistributor.NO_KEY, which generates a relatively balanced load across partitions. Each record is 50KB, resulting in a 20 GB backlog.
The coordinator logs the drain progress:
08:50:41.231 pub msg/s   cons msg/s     total sent     total recv      backlog
08:50:51.281    14,803      482,937    409,624,013      7,814,000  401,810,013
08:51:01.326         0    1,197,627    409,624,013     19,844,157  389,779,856
08:51:11.385         0    1,206,928    409,624,013     32,006,000  377,618,013
08:51:21.437         0    1,220,696    409,624,013     44,243,500  365,380,513
08:51:31.486         0    1,216,198    409,624,013     56,477,500  353,146,513
08:51:41.548         0    1,214,740    409,624,013     68,722,500  340,901,513
08:51:51.620         0    1,195,625    409,624,013     80,776,500  328,847,513
(5 min omitted for brevity in this post)
08:56:03.135         0    1,021,288    409,624,013    369,722,103   39,901,910
08:56:13.183         0    1,017,437    409,624,013    379,949,293   29,674,720
08:56:23.239         0      913,860    409,624,013    389,132,293   20,491,720
08:56:33.282         0      814,609    409,624,013    397,293,940   12,330,073
08:56:43.326         0      247,617    409,624,013    399,782,440    9,841,573
08:56:53.394         0       98,997    409,624,013    400,770,267    8,853,746
08:57:03.531         0        3,946    409,624,013    400,811,267    8,812,746
08:57:13.582         0        4,029    409,624,013    400,851,267    8,772,746
08:57:23.627         0        3,981    409,624,013    400,890,767    8,733,246
08:57:33.672         0        3,882    409,624,013    400,930,767    8,693,246
08:57:43.719         0        3,981    409,624,013    400,970,267    8,653,746
08:57:53.765         0        3,981    409,624,013    401,009,767    8,614,246
08:58:03.820         0        3,983    409,624,013    401,049,767    8,574,246
08:58:13.861         0        3,928    409,624,013    401,089,767    8,534,246
(reached 10 minute drain timeout)
By the time the test reached the short test timeout, consumption was about 3,900 records/s, from a high of 1.2M records/s (no simulated processing time was configured). 98% of the 400M backlog drained in around 8 minutes.
The consumption slowdown started when lag was around 9M records. Extrapolating based on 3900 records/s, it should have taken 6 hours more to drain that 2% of the starting backlog.
What has happened is that due to some skew, half the partitions had drained causing the slow down. With 5 consumers and 10 partitions, each consumer was assigned two partitions, most likely on different brokers. So half of each consumer’s fetches were waiting for 500 ms and return nothing. The aggregate skew was relatively minor (the lightest partition had 39M and the heaviest had 45M), but the lag skew got worse as lighter partitions were drained.
A 400M backlog is an extreme case. But we can trigger the slow down in much smaller backlogs if we use a more skewed message distributor mode. Let’s move onto case 2, where we’ll diagnose the pathological fetch wait problem further.
Case 2 - Draining a skewed backlog
Setup: 1 topic, 12 partitions, 1 & 6 consumers, max.poll.records=500 (the default), backlog size 20M records.
To make this nasty, we’ll use a partition skew using Zipfian distribution with alpha=2. This is an extreme skew where the most heavily loaded partition (p0) will receive 64% of the records (12.8M), p1 will receive 16% (3.1M) and so on until p11 receives < 1% (88K).
We’ll run two tests tests:
with 1 consumer (assigned all 12 partitions)
with 6 consumers (each assigned 2 partitions)
With one consumer
Coordinator output excerpt:
07:58:38.681   pub msg/s   cons msg/s     total sent   total recv      backlog
07:58:48.745         513       65,428     20,094,501    1,057,500   19,037,001
07:58:58.817           0      127,311     20,094,501    2,343,000   17,751,501
07:59:08.882           0      179,256     20,094,501    4,149,000   15,945,501
07:59:18.937           0      225,679     20,094,501    6,421,000   13,673,501
07:59:28.987           0       16,967     20,094,501    6,579,007   13,515,494
07:59:39.032           0        1,991     20,094,501    6,598,007   13,496,494
07:59:49.080           0        1,990     20,094,501    6,618,007   13,476,494
07:59:59.125           0        1,990     20,094,501    6,638,007   13,456,494
08:00:09.174           0        1,990     20,094,501    6,658,007   13,436,494
08:00:19.218           0        1,990     20,094,501    6,678,007   13,416,494
08:00:29.266           0        1,990     20,094,501    6,698,007   13,396,494
08:00:39.310           0        1,991     20,094,501    6,718,007   13,376,494
08:00:49.358           0        1,990     20,094,501    6,738,007   13,356,494
08:00:59.403           0        1,990     20,094,501    6,758,007   13,336,494
08:01:09.451           0        1,891     20,094,501    6,778,007   13,316,494
08:01:19.497           0        1,990     20,094,501    6,797,007   13,297,494
08:01:29.544           0        1,990     20,094,501    6,817,007   13,277,494
Consumption starts strong but quickly drops to just shy of 2K records/s where it remained until the test reached the 20 minute drain timeout. Extrapolating, we can estimate a 2 hour drain time.
Why just below 2000 records/s?
A Prometheus query shows us the lower loaded partitions drained quickly and that the slow down in aggregate consumption correlated to an interval where p2 and p3 finished draining and p0 and p1 consumption dropped massively at the same time.
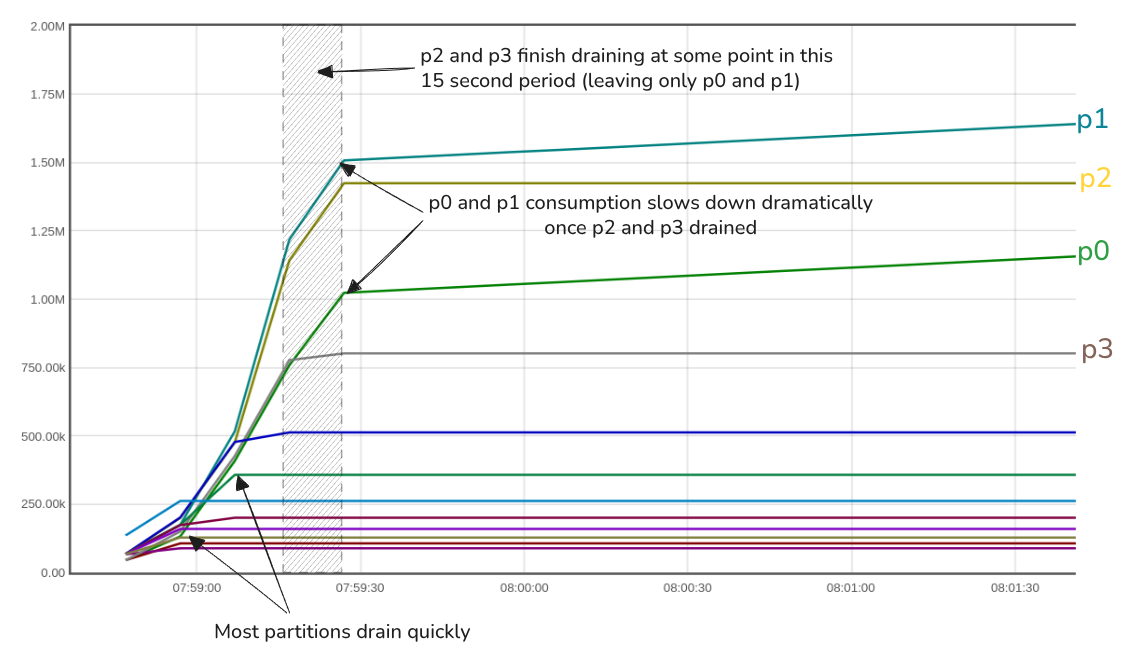
Fig 3. Showing when each partition got drained, and the impact on consumption of the heavy partitions p0 and p1.
Inspecting the partitions, we see that the leader of p0 is hosted by broker-1 and p1 by broker-2.
Partition: 0	Leader: 1	Replicas: 1,2,0
Partition: 1	Leader: 2	Replicas: 2,0,1
Partition: 2	Leader: 0	Replicas: 0,1,2
Partition: 3	Leader: 1	Replicas: 1,0,2
Partition: 4	Leader: 0	Replicas: 0,2,1
Partition: 5	Leader: 2	Replicas: 2,1,0
Partition: 6	Leader: 1	Replicas: 1,2,0
Partition: 7	Leader: 2	Replicas: 2,0,1
Partition: 8	Leader: 0	Replicas: 0,1,2
Partition: 9	Leader: 2	Replicas: 2,1,0
Partition: 10	Leader: 1	Replicas: 1,0,2
Partition: 11	Leader: 0	Replicas: 0,2,1
So we’ve hit the following scenario (where only p0 and p1 have remaining lag):
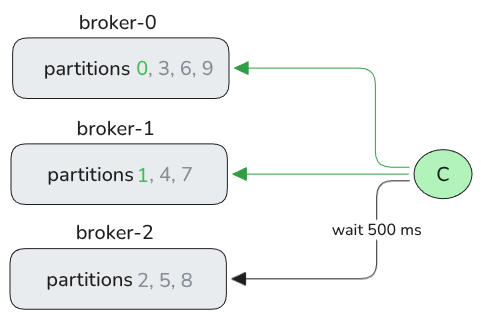
Fig 4. The topology in this one-consumer test.
In a one second period (with zero ms processing time):
Fetch 500 from
broker-0Fetch 500 from
broker-1Fetch 0 from
broker-2with 500 ms fetch latencyFetch 500 from
broker-0Fetch 500 from
broker-1Fetch 0 from
broker-2with 500 ms fetch latency
In one second, the consumer can do two rounds of fetching from p0 and p1 (500 at a time), though in reality there is some overhead, which matches the 1990 records/s.
With six consumers
This test did no better. In fact, the slow down happened far earlier.
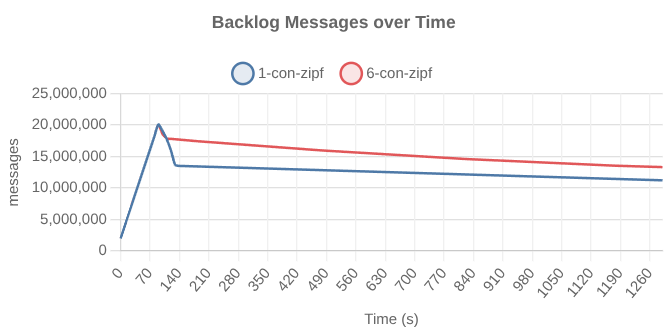
Fig 5. The drain-rate of the one-consumer and six-consumer tests. The six-consumer test hit the slowdown far earlier.
We can see, while the test runs, that partitions p0-p4 still have lag (proportional to the skew).
PARTITION  START-OFFSET  LAG
0          382500        12458820
1          244500        2967926
2          494500        932385
3          225500        576458
4          272500        240509
5          357000        0
6          261500        0
7          200500        0
8          158500        0
9          128000        0
10         106000        0
11         88500         0
Inspecting the partition placements and share group assignments, we that these 5 partitions with lag are spread across 5 consumers. Each of these 5 consumers is assigned one heavy partition (still with lag) and one lighter partition (no drained).

Fig 6. The toplogy and fetch waits in the six-consumer test.
With zero processing time in this test, in a one second period, each of the 5 degraded consumers would:
Fetch 500 records from the heavy partition
Block on the light partition for 500ms
Fetch 500 records from the heavy partition
Block on the light partition for 500ms.
The slow down happened earlier as each consumer fetched only from one partition per broker, whereas the single consumer fetched from 4 partitions per broker, so took longer to completely drain entire brokers.
You might be thinking, how often do we need to drain a backlog, all the while the producer rate is 0? Let’s move onto case 3.
Case 3 - Skewed batch production workloads
Setup: 1 topic, 6 partitions, 1 consumer, max.poll.records=500 (the default), 6 brokers.
One such case of draining backlogs without producer load is that of workloads where producers periodically dump a large batch of records in a topic. In between each dump there are no incoming records at all. We can model this with Dimster using its producerRateSchedule workfield.
# proc time between 10-50 ms, poll record batches processed in parallel
consumerProcMsMin: 10
consumerProcMsMax: 50
consumerProcParallelism: -1
# repeating producer rate cycle
producerRateSchedule:
    type: REPEATING
    segments:
      - fromRate: 1
        toRate: 10000
        durationSeconds: 120
      - fromRate: 10000
        toRate: 0
        durationSeconds: 120
      - rate: 0
        durationSeconds: 180
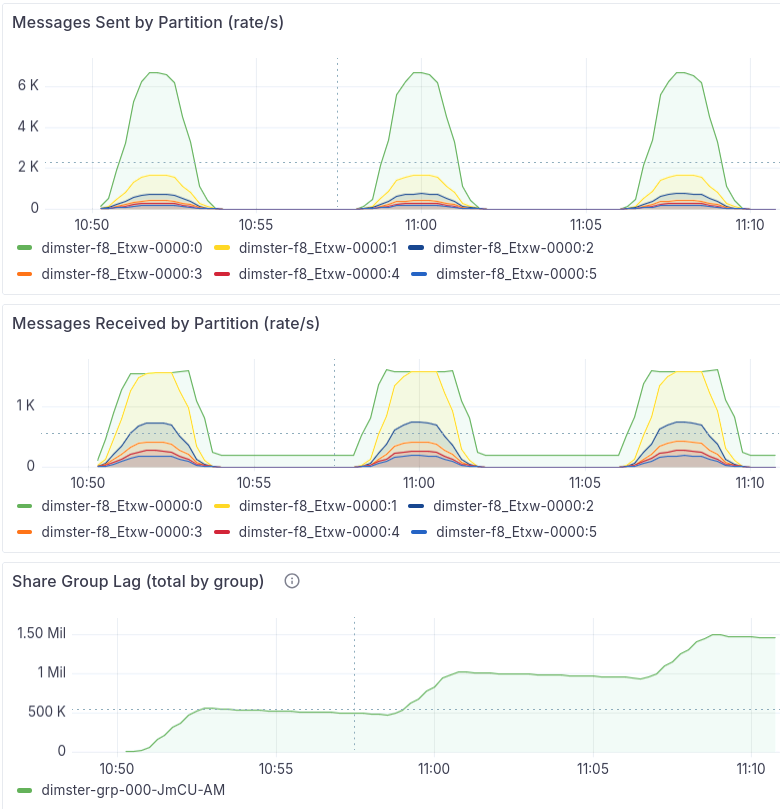
Fig 7. Per-partition rates + aggregate lag. Note that due to the rate calculated over a 1 minute interval, the short peak of 10,000 records/s is not shown.
The consumer can’t handle the batch instantly, it needs time to process it. The consumption rate of the heaviest partition tops out at 1.5K records/s, building lag on that partition. In each of the three producer dumps, once the producer rate dropped to 0 and the 5 lightest partitions got drained, the heavy partition consumption rate crashed due to the fetch wait issue. Each consecutive production-batch increased the lag on the heaviest partition.
In this test I used 6 brokers, to ensure that each partition was on a separate broker, to exacerbate the problem. Obvious, this test doesn’t need 6 brokers, but in production you might run 6 brokers or 12 brokers or more. In such clusters, it would be the norm for the leader replicas of a topic to be not be co-located on the same brokers.
Case 4 - Backlogs with producer load
So far we’ve focus on backlog draining without producer load. But if producers keep going during the drain then the fetch wait issue can be mitigated. The size of the mitigation depends on the magnitude of producer rate. If a record arrives at a light partition twice per second, then the fetch wait issue may not be mitigated at all.
The following chart shows a small backlog from one cycle of a batch-production workload. After the peak of 12,000/s, the producer rate drops to 0 for three minutes, then every two minutes increases until it finally reaches 900 records per second across all partitions (with 64% going to p0).
producerRateSchedule:
  type: REPEATING
  segments:
    - { fromRate: 1, toRate: 12000, durationSeconds: 60 }
    - { rate: 12000, durationSeconds: 600 }
    - { fromRate: 12000, toRate: 0, durationSeconds: 60 }
    - { rate: 0, durationSeconds: 180 }
    - { rate: 50, durationSeconds: 120 }
    - { rate: 100, durationSeconds: 120 }
    - { rate: 150, durationSeconds: 120 }
    - { rate: 200, durationSeconds: 120 }
    - { rate: 300, durationSeconds: 120 }
    - { rate: 400, durationSeconds: 120 }
    - { rate: 500, durationSeconds: 120 }
    - { rate: 600, durationSeconds: 120 }
    - { rate: 700, durationSeconds: 120 }
    - { rate: 800, durationSeconds: 120 }
    - { rate: 900, durationSeconds: 120 }
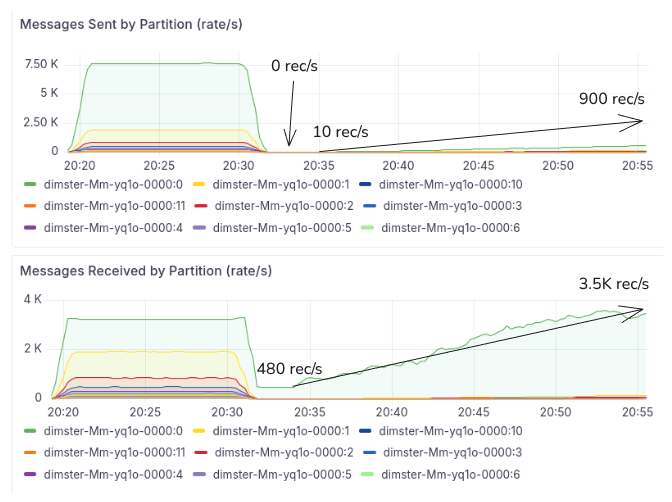
Fig 8. Demonstrating how the producer rate can affect the consumer rate.
We can see that as the producer rate increases, the drain rate of the single partition backlog accelerates. The producer rate accelerates the consumer rate. This tells us that a continued producer rate may or may not mitigate the fetch wait issue. The lower rate, the less effective the mitigation.
Case 5 - Heavy skew + one-record-at-a-time fetches
If we reduce max.poll.records to 1, plus we have fewer consumers than partitions, plus we have serious skew, we encounter a double-whammy. Round-robin fetching that returns only a single record cannot prioritize the heavier partitions, in fact, the heavier partitions are penalized as the lighter partitions cause the consumer to spend most time fetching from them. In the worst case, the consumer spends 500 ms waiting for a fetch to a lighter partition, but comes up empty, while the heavier partition is filling up.
One such case, designed to maximize this pathology is:
6 records per second
12 partitions
6 brokers
max.poll.records=1
average processing time is 10 ms
4 different load skews (via
messageDistributorworkload field):PINNED_PARTITIONS: Almost perfect uniform distributionKEY_ROUND_ROBIN: Light skew.PARTITION_ZIPF with alpha=1.5. High skewNO_KEY: With one producer -> high temporal skew, low aggregate skew.
Why high temporal skew for NO_KEY? Basically, the single producer chooses a partition and sends records to it for a while, then switches to another partition for a while and so on. Within a short period of time, only one partition is receiving records.
You can see the partition skew of these four tests below:
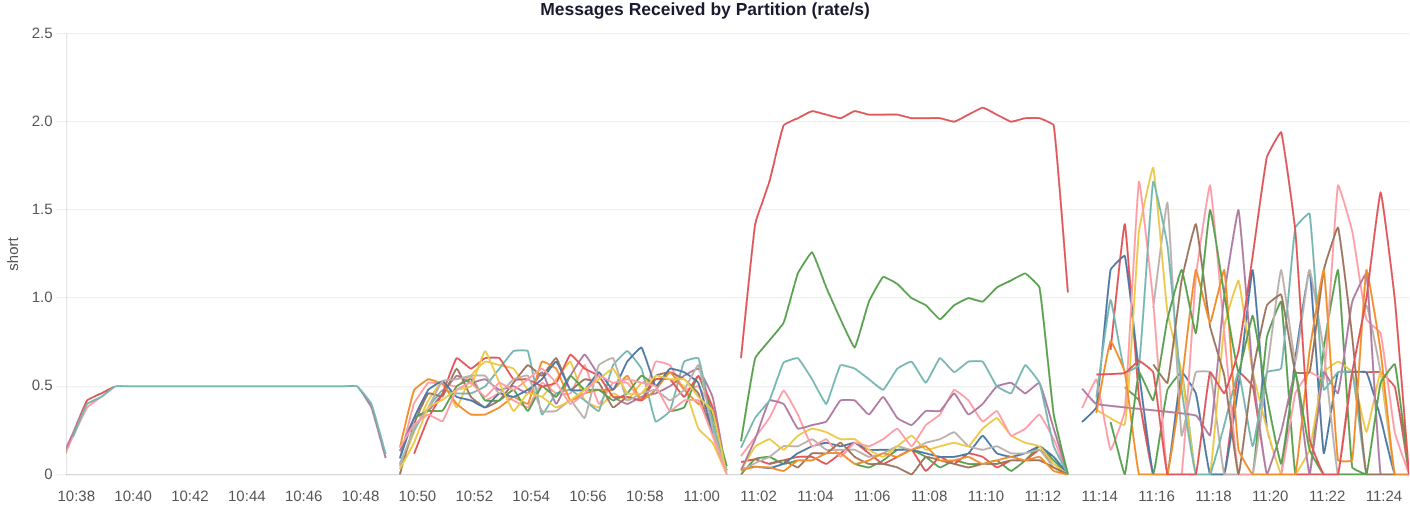
Fig 9. The partition skews of each test (PINNED_PARTITIONS, KEY_ROUND_ROBIN, PARTITION_ZIPF, NO_KEY).
The results show that the Zipfian 1.5 test reached only 2 records/s with one consumer and 5 records/s with six consumers. The NO_KEY test also saw elevated end-to-end latency, though it did not continue to grow.
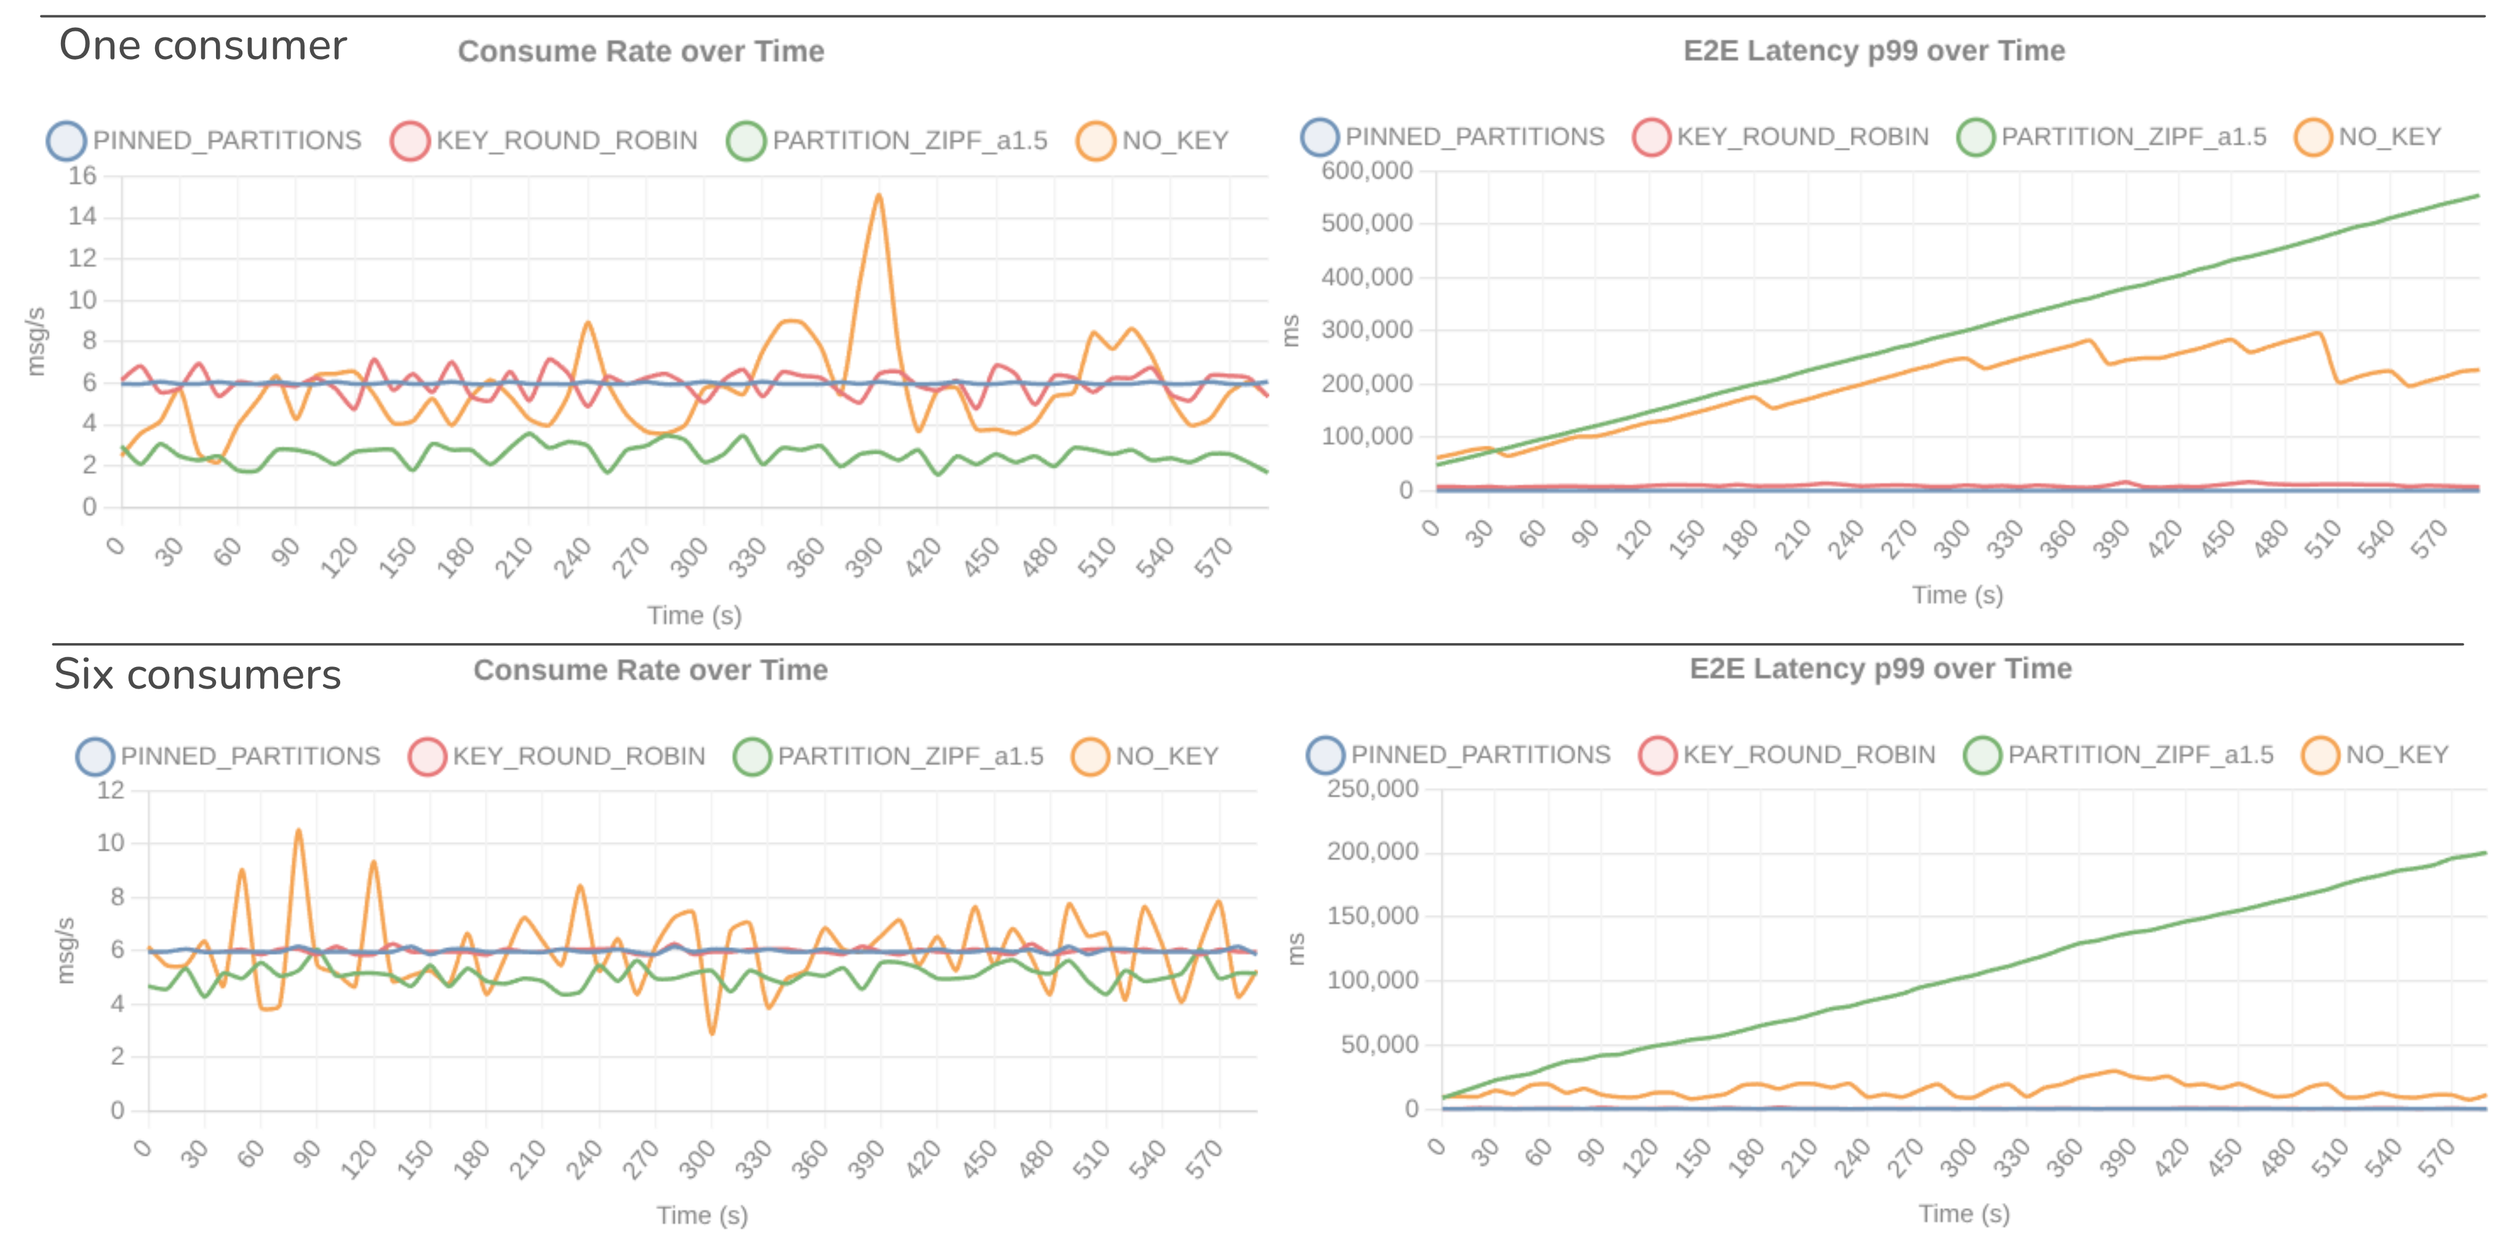
Fig 10. Consumer rate and p99 e2e latency over time, of the four tests.
Mitigating these fetch wait cases
Primary mitigation: If you want to use record_limit, then the best mitigation is to use the partition count as the floor for consumer count. This completely side-steps the fetch wait problem and allows you to use record_limit without any risk of these weird performance issues under various types of skew.
Secondary mitigations (less effective or with drawbacks):
Consider reducing
fetch.max.wait.ms, if you have regular backlogs with no producer load (cases 1-3). The downside is if you get too aggressive, gone is long polling, instead you might hammer the Kafka brokers with a high frequency of fetch requests.Consider increasing
max.poll.recordsif you experience case 5, as it allows the consumer to make up for the long periods between fetches to the heaviest partitions.Consider fixing your skew. However, even if your partitions are relatively balanced, if you accrue a very large backlog, then the lag can be skewed towards the end of the drain period.
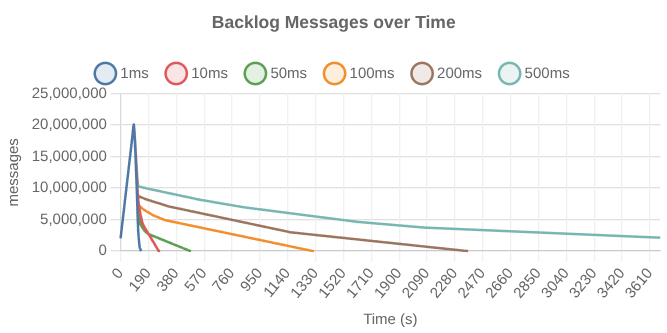
The following chart shows drain times for a high skew backlog with different fetch.max.wait.ms with 6 consumers and no producer load:
How might we mitigate these pathological-fetch-waits with a change in how the Apache Kafka clients work?
Have clients not wait the full timeout period if the last fetch to that broker returned empty. This would help in backlog drain scenarios without producer load, but not low producer load (where fetches are non-empty but high latency).
No round-robin fetch requests. Have the client send concurrent fetches to all brokers of the assigned partitions. However, this weakens one of the main objectives on
record_limit, which is to place a hard cap on the number of records inflight for a given consumer, in order to avoid reaching record timeouts and redelivery.Have an additional communication channel between brokers and clients, so brokers can share lag information with clients (so clients can preferentially fetch from higher lag partitions).
I am sure this particular wrinkle with share groups will get worked out. In the mean time, the most sensible mitigation is to use the partition count as your floor for consumer count when using record_limit.