In my last blog post I introduced Dimster (DIMensional teSTER), a performance benchmarking tool for Apache Kafka with a specific set of philosophies.
In this first share group benchmarking post, we’re going to use share groups as they are not intended to be used, but for a good reason. Share groups allow you to move past partitions as the unit of parallelism by allowing multiple consumers to read from the same partition, using message queue semantics. We’ll run those kinds of tests in the next post. In this post I just want to understand if the mechanics of how share groups work add any additional overhead compared to consumer groups. So we’ll use share groups as if they were consumer groups (by capping consumer count to partition count).
Objective: Use synthetic tests to measure the overhead of share groups compared to consumer groups in identical conditions.
How: Like-for-like tests which use an identical workload/topology using consumerType (CONSUMER_GROUP|SHARE_GROUP) as a dimension. Given identical producer/consumer counts, producer rate, topic/partition counts, do share groups scale as well as consumer groups? Do they add any latency overhead?
These benchmarks are educational, they are not hard numbers, they are not some kind of canonical result (in fact, no such benchmark exists). And again, this is not a realistic test at all, they only serve to understand share group overhead.
The hardware and broker configuration
I ran all these benchmarks on a k3d Kubernetes cluster on my Threadripper 9980X:
64 cores (128 threads)
256 GB DDR5 memory
Two Samsung 9100 PRO 8 TB (with one dedicated to the benchmarks)
Pretty decent CPU and RAM cooling.
This is not a production setup, but the hardware is more than capable of handling a small to medium sized Kafka cluster with excellent performance. The SSD can sustain around 1.7 GB/s once the SLC cache has filled up and none of these benchmarks exceed that in aggregate across the 3 brokers.
All tests were run with TLS between the clients and brokers and between each broker. I prefer to run benchmarks with TLS enabled (though it reduces the numbers) because most people (hopefully?) run Kafka with full TLS.
Dimster uses named environments located in the dimster-config.yaml. Each environment targets a specific k8s cluster (via kubectl context), specifies the Kafka and client versions, sizes the Kafka pods, determines heap sizes, broker and log config files etc, all in one yaml block.
This environment uses 36 of 128 CPU threads (16 of 64 cores) and 72 GB of 256 GB of RAM of my workstation, so we’re not pushing the Threadripper too hard. Note, the ‘requests’ field block is applied to both k8s requests and limits.
The client pod is over-provisioned with 12 CPU cores (24 threads) and 24 GB RAM to avoid any client bottlenecks causing spurious results.
Isolating group performance from load skew randomness
The tests in this post compare consumer groups with share groups. To do that, I tried to isolate other factors as much as possible. Random load skew is one such important factor.
In these tests, I ensured that load was as even as possible over the brokers:
Message distribution over the partitions of a given topic was even.
I used the Dimster message distributor PINNED_PARTITIONS which ensures the number of producers is divisible by the number of brokers and pins each producer to a set of partitions, and each producer round-robin sends to its partitions directly.
Multi-topic tests used a topic count divisible by the number of brokers to ensure even distribution of leaders over brokers.
Consumer counts per group were divisible by the number of brokers to ensure even distribution of partitions over consumers.
Fig 1. Dimster’s partition pinning for even load distribution
This is not like in real-life, but for this post I want to avoid the randomness involved with partition and broker skew so that we can compare consumer group vs share group performance without load skew randomness playing a role. I’ll be writing about and running benchmarks with partition and broker skew in a future post.
Some throughput benchmarks
For the throughput benchmarks, I used Dimster’s explore mode, which probes the cluster to find the highest sustainable throughput while staying under a target end-to-end latency in ms and percentile (50 ms, p75 in this case). It measures e2e latency per-partition and uses the latency of the poorest performing partition as the yardstick.
Explore mode runs in phases:
Ramp. Start with a low throughput and keep doubling the throughput after a configured interval. Once the e2e latency exceeds the limit, move to the next phase.
Search: Perform a binary search within the bounds of [0 - max-ramp-throughput]. It starts at the midpoint and if it can sustain that throughput, it searches the high range starting at the midpoint. If it can’t sustain it, then it searches the low range. It recursively performs the search until the current search range size is < 5% of the throughput. Then it moves to the sustain phase.
Sustain: The throughput identified by the search phase is maintained for a prolonged period. If it passes, the test is complete. If it fails to sustain (under the target e2e latency), it goes back to the search phase, with the failed sustain throughput as the new upper bound of the search range.
The sustain phase is successful if 80% of the intervals (30 intervals of 10 seconds by default) meet the latency criteria. This rule exists as explore mode is trying to find the highest sustainable throughput which sits on the edge of the cluster’s limit, allowing for some latency spikes.
I ran explore mode on the following workload:
./dimster explore localBeefy -w run/workloads/explore-limits-test/explore-limits-share-vs-classic-basic2.yaml
Scenario 1 - Varying partition and client counts
The first scenario has 4 test points which co-varies 4 workload aspects related to partition, client counts and consumer type as dimensions, repeating the tests 3 times.
Fig 2. The merged result of three repeats (only small variance between runs)
We see that share groups matched or even exceeded consumer group performance. Moreover, this pattern was broadly the same across the three test repeats. We can’t infer this as a generalizable result based on this one test, but my general observation, having been running these tests for a few weeks, on EKS clusters, my Threadripper and my Mac, is that throughput in this kind of synthetic test is comparable (between consumer/share groups).
Scenario 2 - Varying fanout
This scenario involved 1 topic with 12 partitions with a fanout of 2 and then 6.
Fig 3. The merged result of three repeats (only small variance between runs)
The surprising result was that share groups maintained a higher sustainable throughput with a fanout of 6. Explore mode is sensitive to spiky latency, and one thing I’ve observed is that share group latency can be more stable under stressful loads than consumer groups. Again, this may not be generalizable, but it shows that share groups might actually outperform consumer groups in some cases.
I think the main takeaway from these limited tests is that share groups and consumer groups are in the same ball park in terms of raw throughput.
Some latency benchmarks
The throughput benchmarks were a stress test of sorts, pushing Kafka right up to its limit. CPU was maxed out.
We don’t want that for the latency benchmarks. We’re not going to push the Kafka cluster to the limit as we want to measure latencies within the performance envelope. With 4 vCPUs, around 100 clients and TLS, a 15 MB/s (1.3 TB daily) workload fits comfortably inside that envelope.
I used run-mode, which are the standard fixed throughput benchmarks (best for measuring latency). I ran a single test campaign with 3 scenarios where consumerType was the dimension:
1 topic with 60 partitions, 30 producers, 60 consumers.
12 topics with 6 partitions, 6 consumers per topic, 3 producers per topic.
6 topics with 6 partitions, 3 consumer groups per topic with 6 consumers each, 3 producers per topic.
All ran with an aggregate producer rate of 15000 msg/s with a 1 KB message size (15 MB/s).
./dimster run localBeefy -w run/workloads/run-test/run-consumer-group-vs-share-group-various.yaml
Scenario 1 - 1 topic, 60 partitions
Fig 4. End-to-end latency (p99) over time (10 second intervals). Note: you can select a time range on Dimster charts to zoom into a sub-range.
Under this lighter load, we see that share groups add some overhead, with the e2e p99 latency being a little more choppy than the much flatter consumer group latency.
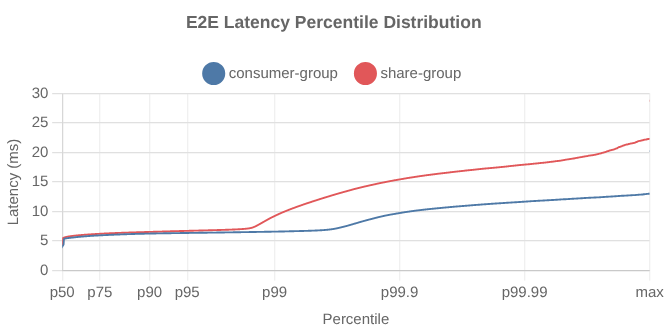
Fig 5. End-to-end latency distribution. Note: you can select a percentile range on Dimster charts to zoom into a sub-range.
Scenario 2 - 12 topics, 6 partitions each (72 parts total)
Fig 6. p99 end-to-end latency over time (10 second intervals)
The sharegroup overhead is more pronounced in this test.
Fig 7. End-to-end latency distribution.
Scenario 3 - 3 topics, 6 partitions per topic, fanout 3
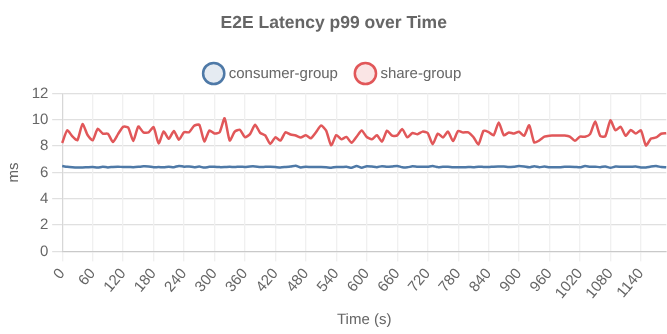
Fig 8. p99 end-to-end latency over time (10 second intervals)
Again we see the same overhead.
The takeaway is that for an adequately sized cluster that is not stressed by the workload, we can expect to see some small share group end-to-end latency overhead.
Just to show you this isn’t an artifact of running these tests on k3d on a single workstation, we see the same pattern on a 50 MB/s test I ran a few weeks ago on AWS EKS with the m6i.2xlarge instance (8 vCPU, 32 GB RAM, EBS).
Fig 9. 50 MB/s test, p99 end-to-end latency over time (10 second intervals) on an EKS cluster
And a 150 MB/s test which was more stressful
Fig 10. 150 MB/s test, p99 end-to-end latency over time (10 second intervals) on an EKS cluster
We see the typical Kafka latency spikes related to log flushing and rotation (which has this predictable cadence due to how all load starts at the same time, at a constant rate, on one topic).
Resource usage
The share group tests consistently used more CPU than the consumer group tests, which is understandable given share groups do a lot more accounting and state management than consumer groups.
For example, the first repeat of scenario 1 of the latency test (executed as test points CG, SG, CG, SG, CG, SG):
Fig 11. CPU over three apache/kafka pods
Useful but not realistic
In all these tests, consumers did nothing with the messages except record some metrics. In the real world consumers write to databases and call APIs. It might take anywhere from < 1 ms to 30+ seconds to process a message. More useful benchmarks simulate consumer processing time which is exactly what we’ll do in the next post. When we add processing time, we start to see where share groups really shine.
To summarize some findings from this post:
Share groups add a little overhead which might show up in a latency benchmark.
Share groups consume more CPU.
Raw throughput benchmarks will probably see varied results, but share groups are not fundamentally slower than consumer groups.