Dimster = DIMensional teSTER for Apache Kafka
On GitHub: https://github.com/dimster-hq/dimster
Most of my career in distributed systems has been as a tester, performance engineer and formal verification specialist. I’ve written performance benchmarking tools in the past, for RabbitMQ and Apache Pulsar but in recent years I’ve used OpenMessagingBenchmark (OMB) to run benchmarks against Apache Kafka and other messaging systems. But OMB is hard to deploy and has several limitations compared to more sophisticated benchmarking systems I’ve developed in the past. With Claude becoming so much better since Christmas I decided to write a Kafka-centric performance benchmarking tool, with a lot of inspiration from OMB. I took the bits I like about OMB and the things I like about the tooling I’ve built in the past, to make a performance testing tool for testing Apache Kafka.
In this post I’ll introduce some aspects of Dimster that are core to its design:
Dimensional testing
Shareable, self-contained results with reproducibility in mind
Test modes
Benchmark prep and post-processing
Kubernetes as a standardized runtime
1. Dimster (DIMensional teSTER) is born
A benchmarking and stress testing technique I’ve used for years is something I have called “Dimensional Testing”. We can think of all the configs and workload aspects as forming N-dimensional space. Within that space we can explore the impact of points in that space along a single dimension, or even co-varying dimensions. Take a config or an aspect of a workload as a dimension, and run a series of identical benchmarks where a set of points along that dimension are explored (while everything else remains the same). The dimension could be a client config, such as batch.size or acks. It could be an aspect of the workload such as number of consumers, type of consumer, number of consumer groups, the partition count, the produce rate and so on.
There are hundreds of dimensions to explore, which requires some patience and care lest you become overwhelmed. The below depicts just three dimensions, and a set of three scenarios which test performance along one or two dimensions at a time.
Fig 1. Three examples of varying or co-varying an aspect of a workload as dimensions
Each of the above 16 test points (across 3 scenarios) is a separate benchmark, with a fresh topic, warm-up time, recorded time, and cooldown time etc.
The generated charts for throughput and various latencies are repeated for each of the three scenarios, with each test point within a scenario plotted as a series/bar on those charts. This makes it easy to compare the performance results of varying the values of a single dimension (or co-varying values across multiple dimensions).
Fig 2. Each scenario maps to a set of charts, with the test points as data series.
Example: Consumer groups vs share groups
With share groups being relatively new, I could compare the performance of regular consumers against share group consumers, with identical benchmarks where the dimension explored is consumer type (CONSUMER_GROUP|SHARE_GROUP).
The following test has as the base workload of ten topics with each topic having 6 partitions, 6 consumers and 4 producers. Each scenario changes the producer rate, and compares consumer groups to share groups. Record keys are used, so batch sizes will be small, which is a tougher workload than a no-key test which typically results in larger batches.
The charts below show the results for an EKS deployment with Kafka deployed on 3x m6i.2xlarge with 300 MB/s provisioned gp3.
50 MB/s
At 50 MB/s we see that p99 end-to-end latency is stable, with roughly 15 ms overhead for share groups.
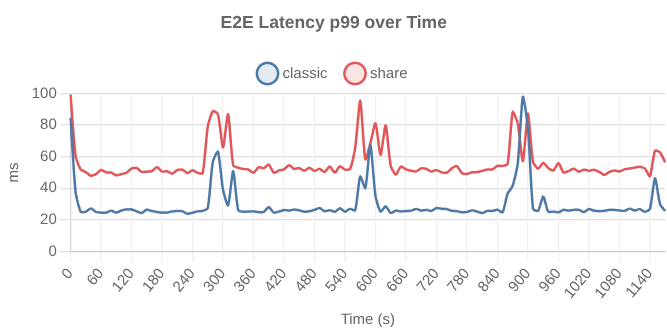
200 MB/s
At 200 MB/s, p99 end-to-end exhibits peaks in a periodic fashion.
Example: 2, 4 and 8 CPUs
Dimster uses environments. The sizing of a test is determined by which environment is used. I ran some share group consumer scaling tests, with full mTLS, on Kafka clusters assigned 2, 4, and 8 CPUs. These are the equivalent of vCPUs, as my Threadripper has SMT (hyperthreading) enabled.
2-CPU environment on my Threadripper:
I ran the following workload with the above environment, with the CPU requests/limit of 2, 4 and 8.
Then I used the dimster compare command to generate comparison charts based on the JSON result files of each run. Each chart compares each test point side-by-side.
10k msg/s - 1000 consumers (6th test point in 1st scenario)
We see that 2 CPUs fare a lot worse than 4 and 8 CPUs.
100k msg/s, 250 consumers (4th test point, 3rd scenario)
The 2 CPU cluster simply can’t keep up with 100k msg/s and 250 consumers.
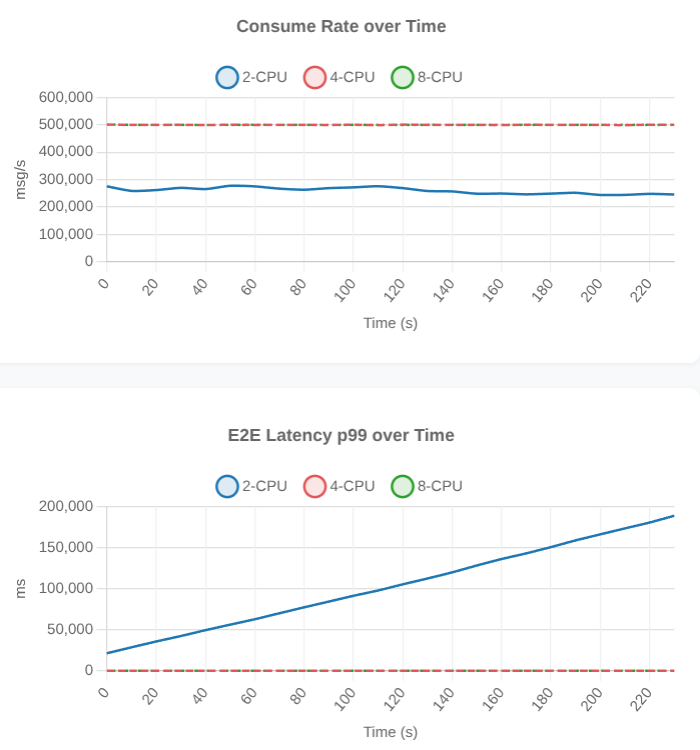
If we unselect 2-CPU, we see that 4-CPU and 8-CPU was ok.
Dimster charts are interactive. Series can be toggled, time and percentile ranges can be selected.
2. Results as shareable assets
One thing I really like about OMB is that it produces a JSON file for the results. These files are easy to store and easy to share. But there was also a lot missing for full traceability and reproducibility.
Dimster includes the following in every test campaign result (a set of files in a result directory):
Results:
The JSON result file which contains all the test point performance results. For each test point, it includes the effective workload and client configuration. It also includes the hardware and other metadata to know what the benchmark was run against.
A CSV file generated from the result JSON file (to make it easy to put in a spreadsheet or run custom visualizations).
Source configs: The source workload file itself, as well as any additional files such as any dedicated client config file, the broker config file, the version of Kafka, the version of the Kafka clients, and the CPU/memory/disk given to the brokers and clients.
Log files: the log files of dimster-core, the benchmarking framework, and each Kafka broker.
Charts: Throughput and latency charts (clickable, zoomable) generated from the result JSON file.
Dashboards: Grafana dashboards converted to interactive HTML files.
I can run a test campaign then send you the results and you’ll be able to reproduce the results because you know exactly what was run and on what. The results are also completely self-contained, if you want to see the dashboard to look at Kafka metrics during the test, it’s right there as an HTML file in the results. No need for access to Grafana and Prometheus and no need to keep monitoring infrastructure around, it can be ephemeral.
3. Test modes
Dimster comes with four test modes (which all support dimensional testing):
Run: Fixed throughput benchmarks, plus:
Live-interaction. Run-mode also supports live interaction with the user. The user can change the producer rate, number of producers and consumers, message size, etc.
Availability: Optionally measure availability (producer/consumer/aggregate) during the standard run-mode benchmark.
Explore: Discover the highest sustainable throughput while staying under a target end-to-end latency and percentile.
Drain-backlog: Build a backlog and time how long it takes for the consumers to drain it. Optionally set a producer rate during the drain phase, such as when testing if a cluster is big enough to drain a backlog while under normal producer load.
Correctness: Detects data loss, data corruption, out-of-order delivery and duplicates.
Example 1: Peak sustainable throughput, 1 partition, share group consumers
Explore mode on my Threadripper. The idea was to see the bottleneck of a single partition, as consumers are scaled out. The rule was for p75 e2e latency to stay below 50ms.
Example 2: Consumer group vs share group with 1 ms processing time
The prior example was an unrealistic synthetic test where the consumer spent no time processing. This explore test added 1 ms consumer processing time per message with 300 consumers. It compared a 300 member consumer group with 300 partitions, vs a 300 member share group, with 5, 10, 25 and 50 partitions.
Share groups managed the same throughput (95% of theoretical max based on 1 ms processing time and consumer count), on only 10 partitions. Consumers groups needed 300 partitions.
Personally, explore and run are my bread and butter benchmark modes. For a given workload I usually start by finding the throughput limit where Kafka transitions from normal stable performance into degraded territory. I either use run mode and use live interaction to discover the performance limit, or I use explore which is slower but I can leave to run and it discovers the limit in an automated way. For latency benchmarks, once I know the limit, I can craft benchmarks that fit inside the performance envelope for that workload on the specific version of Kafka on the specific hardware I am using.
4. Benchmark prep and post-processing
The Dimster CLI has some commands that help before running benchmarks and for post-processing.
Dimster resources command
The resources command calculates the network and disk throughput required to service a workload. This is important in the cloud for selecting the right instances, ensuring that baseline network and disk throughput are greater than the workload’s demands.
Dimster compare command
Compare different runs that were executed on different hardware, different broker configurations, different broker versions etc.
Dimster pivot command
You can slice and dice the data any way you want based on the CSV data. However, you can also pivot the results and generate a chart with the pivot command. This compares the Nth test point across all scenarios.
5. Kubernetes as a standardized runtime
Dimster is easiest to use with Kubernetes. Dimster has a CLI you use from your laptop which speaks Kubernetes and leverages it to run benchmarks on any hardware, any cloud, any laptop or workstation using the exact same orchestration logic. All it needs is a properly configured k8s cluster. It could be minikube or k3d on a laptop or workstation, or AWS EKS or Google Cloud GKE or your own in-house cluster.
You can tell Dimster to deploy Apache Kafka to a stateful set in the k8s cluster:
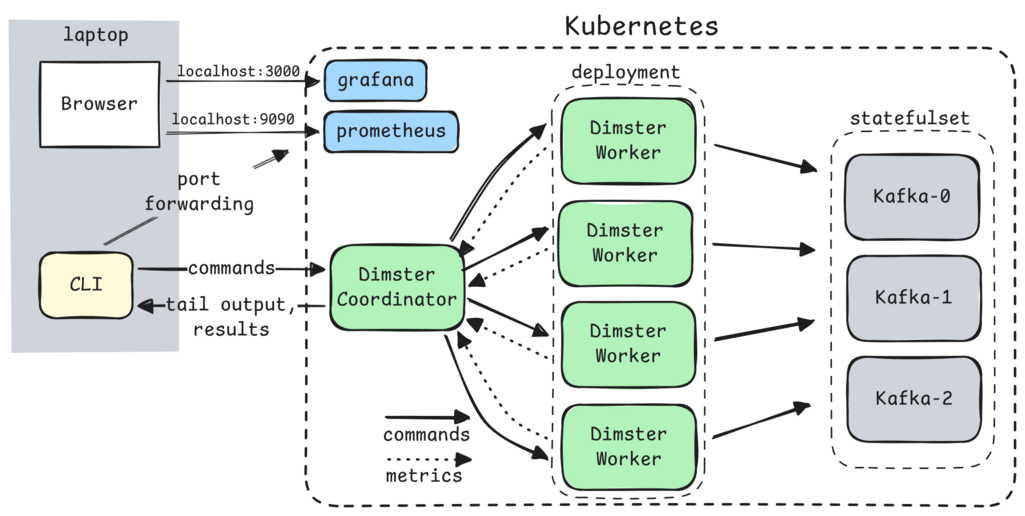
Fig 3. Dimster architecture in full deploy mode
Or point Dimster (deployed to k8s) at a Kafka service or in-house Kafka cluster. When testing a Kafka service, you can provision a single powerful instance for the Dimster coordinator and worker, and deploy them to a local k8s distro such as Minikube, K3d or Kind. A single worker will happily consume all the cores and memory you give it.
Fig 4. Dimster architecture in external deploy mode
Or run a super-slim full setup in a tiny minikube/kind/etc local k8s distro:
Fig 5. Dimster deployed in a tiny local k8s cluster
The workflow is the same. If you can provide a k8s cluster, then Dimster does the rest. Deployment is really simple, monitoring, gathering results, troubleshooting is all simplified via a mix of the CLI being relatively capable, and k8s providing a well-understood platform.
K8s is not obligatory, you can run dimster-core directly as a Java program, and point it at a Kafka cluster already provisioned. But you lose many features such as monitoring, live-interaction, automatic gathering of logs, automatic chart and CSV generation and so on. However, you can use the post-processing command dimster chart to generate the charts of a result JSON file.
Run the Java directly via the benchmark script:
./bin/benchmark -w path/to/workload file
Playing with Dimster
I will be publishing a blog post regularly about Dimster and what you can do with it. So stay tuned.
I invite you to go and play around with Dimster, even if it's just running benchmarks on your laptop or workstation. You can get an idea of what charts get produced, what kinds of benchmarks you can run, trying out dimensional testing etc. The docs are pretty decent and should cover most of it. It’s fully featured but still a 0.X version. Myself and a Confluent colleague are the only ones who have run it thus far, so there may be bugs you encounter, if you do encounter a problem, please open an issue with repro steps.
If you want to run serious benchmarks, you’ll likely need an EKS or GKE type of Kubernetes cluster. Dimster comes with a special CLI for EKS to deploy EKS with node groups for Kafka, Dimster workers/coordinator, Grafana/Prometheus, as well as storage classes for gp3.
While evaluating consumer group vs share group consumers, I’ve been running benchmarks in k3d on my beefy Threadripper 9980X workstation with 64 cores (128 threads), 256 GB RAM and an Samsung 9100 PRO 8TB SSD, which is plenty to run an entire medium sized Kafka cluster plus workers on it. I’ll be sharing some share group benchmarks tomorrow.
Happy testing!