All tests were executed against Kafka 4.3.0 using Dimster.
In the last post Broker-Visible vs Client-Local Parallelism we looked at two ways of scaling Kafka consumption. The final unit of parallelism can be visible to the broker, as consumers, or it can be local to the client, as threads, virtual threads, async tasks, or some other execution mechanism hidden behind a smaller number of consumers.
Broker-visible parallelism is simple to reason about: if each consumer processes records serially, we add more consumers to increase parallelism. But each consumer adds overhead to the brokers: broker-side protocol state, TCP connections, group membership, fetch state, and participation in the consumer or share group protocol. With long processing times and/or high throughput, the required number of parallel workers can easily exceed what is practical to model as broker-visible consumers.
That is where client-local parallelism becomes important. Instead of scaling by adding more consumers, each consumer application can poll records and process them concurrently inside the client. This allows a smaller number of Kafka consumers to drive a much larger amount of parallel work.
In this post, we’ll compare client-local parallelism with consumer groups and share groups using the Apache Kafka clients, by way of Dimster, the benchmarking tool used throughout this series. Dimster uses the official Apache Kafka clients under the hood. The main comparison is between two styles of client-local parallelism: blocking and continuous styles.
Client-local parallel processing with the Kafka clients
At the API level, applications obtain records by calling consumer.poll(Duration), then later record their progress by committing offsets or acknowledging records. Under the covers, the client sends fetch requests and commit/acknowledgment requests to the brokers. There is some indirection between API calls and network requests, but every parallel processing style has to fit into this general poll/commit cycle.
Consumer-group consumers commit offsets (one offset per partition) whereas share-group consumers commit a set of per-record acknowledgments. Any parallel processing style must fit into this fetch/commit style.
We can classify parallel processing within this fetch/commit style into two main methods: Blocking and Continuous
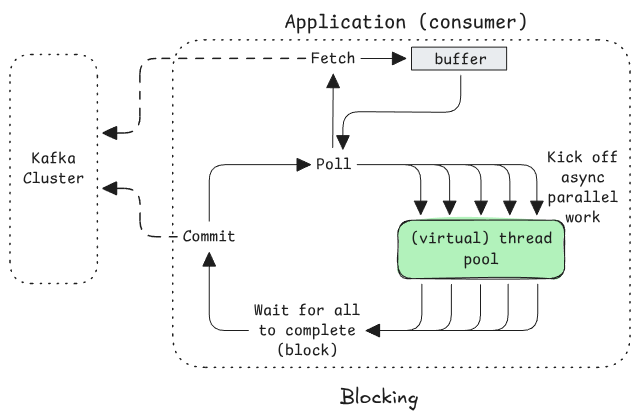
Blocking (one big loop)
Poll -> kick off parallel processing -> block on completion of all -> commit -> (repeat)
Continuous (Decoupled polling, processing and commits)
There are many implementation options for decoupling polling, processing and commits, but the general pattern can be classified into two main mechanisms:
Poll -> Dispatch loop: each record submitted for background processing. Keep polling independently of processing (though implement backpressure by limiting the number of inflight records, i.e. stop polling when your processing buffer is full).
Accumulate -> Commit loop: Accumulate completed records to commit opportunistically.
If you are rolling your own logic using the Apache Kafka clients (rather than choosing a parallel processing library), blocking is by far the simplest to code, but the most inferior in terms of performance profile. The Kafka clients support both blocking and continuous styles with consumer groups, but only blocking with share groups.
Why don’t share groups support continuous mode with the Apache Kafka clients? It’s simple. You can only acknowledge a record from the current poll batch. If you try and acknowledge a record from the previous poll, it throws an exception. This may or may not change in the future, but it’s worth knowing this if you were planning on implementing a continuous parallel processing style with the AK clients and share groups.
Simulating ‘blocking’ and ‘continuous’ with Dimster
Dimster supports parallel processing simulation with both blocking and continuous mode, but share groups only support blocking mode. Dimster doesn’t actually process records (except for recording metrics), instead it simulates processing time by calculating how long each record would take, based on randomized processing times between the min/max.
In Blocking mode, it figures out how long the processing would take to process a poll batch (based on the level of parallelism requested in the workload file) and performs one sleep per poll-loop-iteration for the aggregate processing time.
In Continuous mode, it feeds each record, along with its randomized processing time, into an in-memory delay queue (accounting for how much parallel processing is requested). Separately it polls, drains completed records from the delay queue and commits continuously.
Benchmarking blocking vs continuous, consumer groups vs share groups
Let’s run some benchmarks with Dimster in blocking vs continuous modes. We’ll use an example workload with:
A long processing time of 1-5 seconds (3 second average)
A moderate rate of 1,000 records a second.
Each consumer application is capable of processing around 300 records concurrently.
The aggregate parallelism is 3,000 (rate x avg proc time) which puts us in the territory where serial consumers are not a great choice. Firstly, share groups only allow groups of up to 1000 members, and regardless, 3000 consumers would create more than 9000 TCP connections (in a three broker cluster), which is excessive for one use case of this size. We need to parallel process inside the clients.
We’ll run 3 tests:
Consumer group blocking style
Consumer group continuous style
Share group blocking style
The workload file (single scenario with three test points):
In the test analysis we’ll cover the configurations in this workload.
Just show me the results
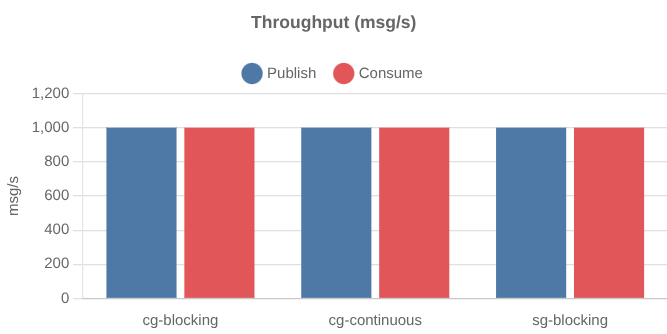
All three tests resulted in the same 1000 records/s throughput.
But end-to-end latency differed a lot, with consumer group continuous style easily winning.
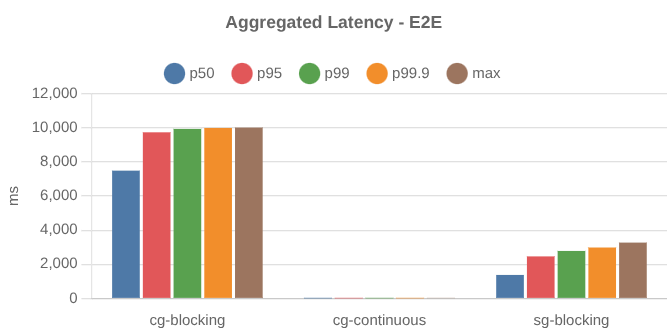
The latency distributions:
The latency distribution of only cg-continous:
Continuous is the clear winner here.
You can download the Dimster result tarball here.
Understanding the results
Let’s dig into the results and why the workload was configured the way it was.
Blocking style - Consumer Groups
With blocking mode, consumption is a factor of the poll rate and the number of records per poll:
consumer rate = poll rate x records per poll
The poll rate is determined by how long the application blocks waiting for all records to complete. The number of records per poll is bounded by max.poll.records (though it is a soft cap).
When estimating the poll rate in blocking mode, the average processing time is the wrong choice as we’ll really block for the longest processing time of a poll batch (not the average). With 100s of records per poll, we’ll likely hit or get close to the upper bound 5 seconds (assuming uniform distribution). More likely in the real world, we’d see a non-uniform distribution where, for example, p95 might be 500ms, but p99.9 be significantly higher at say, 5 seconds.
The workload we’re using has a rate of 1,000 records/s. Each consumer is capable of processing around 300 records concurrently so we set max.poll.records=300. With a poll rate of 0.2 (one every five seconds), the consumption throughput per consumer is 60 records/s. To reach 1000 records per second we need at least 17 consumers (and partitions), so I configured 18.
The effective workload of test point 1 cg-blocking:
The consumers managed the 1000 record/s but for some reason, the max end-to-end latency (processing-start-timestamp - publish-timestamp) was double the worst processing time.
It turns out that this is a natural effect of Blocking mode with consumer groups. The highest e2e latency will be at least the blocking time of the previous poll iteration (as records kept arriving in the partition throughout the blocking time).
However, you may note that the above e2e latency numbers are p50 is 7.5s and max is 10s. This can occur in blocking mode due to the way polls return buffered records and trigger an asynchronous fetch (pre-fetch) to fill the buffer before the next poll. Think of the consumer as having a two-step delivery path: first Kafka records are fetched asynchronously into the consumer’s internal buffer, and poll() returns buffered records to the application.
In the above diagram, we see the application spending 5 seconds processing a batch it just received, but that batch had already spent 5s in the buffer as it was filled by a fetch triggered by the previous poll (5s before this one).
This kind of e2e latency might not be a big deal, considering the long processing times. If we want to lower the e2e latency significantly, then we need the continuous style.
Continuous style - Consumer Groups
With continuous style, we have decoupled polling from processing and we can use the average processing time of 3 seconds to calculate the consumption rate per consumer (we are not constrained by the max processing time).
Parallelism is not defined by the number of records per poll but the total inflight capacity of parallel work (threads, virtual threads, async tasks). We can feed that capacity with a constant stream of small polls and stop polling once that capacity has been reached (polling again once there is free capacity again). Because the application can poll at a high frequency, buffered records remain in the buffer for only a few milliseconds before being submitted for parallel processing.
In continuous mode, worker throughput is approximately:
in-flight capacity / average processing time
In Dimster the inflight capacity is set by the workload field consumerProcCapacity.
With a capacity of 300 and average processing time of 3s, each consumer can process 100 records/s. To reach 1000 records per second, we need 10 consumers and partitions. I set the capacity to 400 to add some wiggle room.
The effective workload of test point 2 cg-continuous:
This time we see that e2e latency remains very low, as we don’t block on the longest processing time.
Blocking style - Share Groups
Again with the Blocking style, so:
The per-consumer poll rate is determined by the highest processing time per batch.
The aggregate parallelism is 5000 (
1000 rec/s x 5s)
Share groups introduce a new constraint, the per-partition inflight budget (aka group.share.partition.max.record.locks). The aggregate inflight budget must exceed the aggregate parallelism of 5000. The default is 2000 per partition and so just three partitions gives us an aggregate inflight budget of 6000.
Another difference is that we can have multiple share consumers per partition. If we use 3 partitions then each partition needs parallelism of 1666 (5000 / 3 = 1666). With max.poll.records=300, we need 6 consumers per partition to cover it.
The effective workload of test point 3 sg-blocking:
You might expect end-to-end latency to be lower than the blocking consumer group test and you’d be right!
Each partition has six consumers so the time period between fetches is lower (records spend less time in the partition before being fetched). We are also using record_limit so there is no pre-fetching which inflated the e2e latency in the consumer group test.
But it’s still higher than you might expect. Per-partition, we have 6 consumers with a fetch/poll rate of 1.2 per second and 333 records arrive per second. We might expect the worst e2e latency to be 277 ms (333 / 1.2). So what’s going on?
Fetch clustering
The above calculation assumes each fetch arrives evenly spread over time. But fetches cluster to a greater or lesser degree, there is no coordination between the consumers.
If a long period passes with no fetches, then the first fetch that arrives can drain the accumulated lag, and subsequent fetches just return the handful of records that arrived since the prior fetch a few milliseconds before.
The only way for the consumers in this workload to reach the 1000 records/s is if each fetch returns around 277 records per fetch on average. With fetch request clustering, the only way fetches can be filled to this extent is if lag has built up. If 6 consumers attempt to fetch 300 records at exactly the same time, only if lag has reached 1800 on that partition will all those fetches return full.
So the consumers settle into a stable amount of lag that is high enough such that fetches return with enough records to keep up. If consumers catch up and lag goes to 0, consumption throughput will naturally drop down until lag builds up to allow for the full consumption rate.
Final thoughts
Client-local parallelism is often the only practical way to handle long record processing times. But how that client-local parallelism is implemented in Kafka fetch/commit cycle has a big impact on latency. A blocking poll → process → commit loop is simple, but it couples consumption progress to the slowest record in each batch, which lowers poll frequency and can inflate e2e latency even when there is plenty of processing capacity.
Continuous polling decouples polling, processing, and committing, allowing the client to keep records flowing into a processing pool while applying backpressure through an in-flight limit. For consumer groups, this provides much better latency and usually requires many fewer consumers and partitions for the same workload.
Share groups improve the broker-visible side of the problem by allowing multiple consumers per partition, but the current Apache Kafka clients still constrain client-local parallelism to the blocking style. If your goal is highly parallel, low-latency processing, consumer groups remain the better fit. Removing the same-batch acknowledgment constraint from the Kafka share consumer would make that style possible with share groups as well.
In the next post, I’ll look at some pathological share-group workloads with some gotchas to watch out for.